
2026 Rookie Super Model: A Data-Centric Approach To Grading Rookie Prospects
Dwain McFarland unveils the 2026 Rookie Super Model, highlighting historical accuracy of the model, what's new for 2026 and more.
We are quickly approaching the NFL Draft with the Scouting Combine in the books. That means it is time for year four of the Rookie Super Model. In recent years, fantasy drafters have become more aggressive with rookies, making it more important than ever to understand the range of outcomes for prospects. The road to fantasy championships can come down to how we value rookies versus the market, and that all starts now!
I have been in the lab researching and implementing updates to the model for the past month. Over the next three weeks, we will unveil all of the findings.
- March 5th: The Rookie Super Model is LIVE!
- March 12th: Wide Receiver profiles
- March 19th: Tight End profiles
- March 26th: Running Back profiles
All of the players' Rookie Super Model scores will also be integrated into our brand new (and free!) 2026 NFL Draft Guide. It's an interactive tool that breaks down our Big Board, Mock Drafts, Team Needs and so much more.
Below is everything you need to know about the Rookie Super Model.
What is the Rookie Super Model?
The Rookie Super Model is a data-centric approach to grading rookie prospects based on inputs that best predict NFL production.
Each rookie RB, WR and TE is rated between 50 and 100. The higher the score, the more likely that prospect is to be successful in the NFL over their first three seasons.
We decided to call it the Super Model because A.) Ian Hartitz thought that would be funny, and B.) for some inputs, it mines advanced data that wasn't available for prospects until 2014, when PFF began charting college football. By incorporating this data and other ideas, we aim to further evolve prospect evaluation.
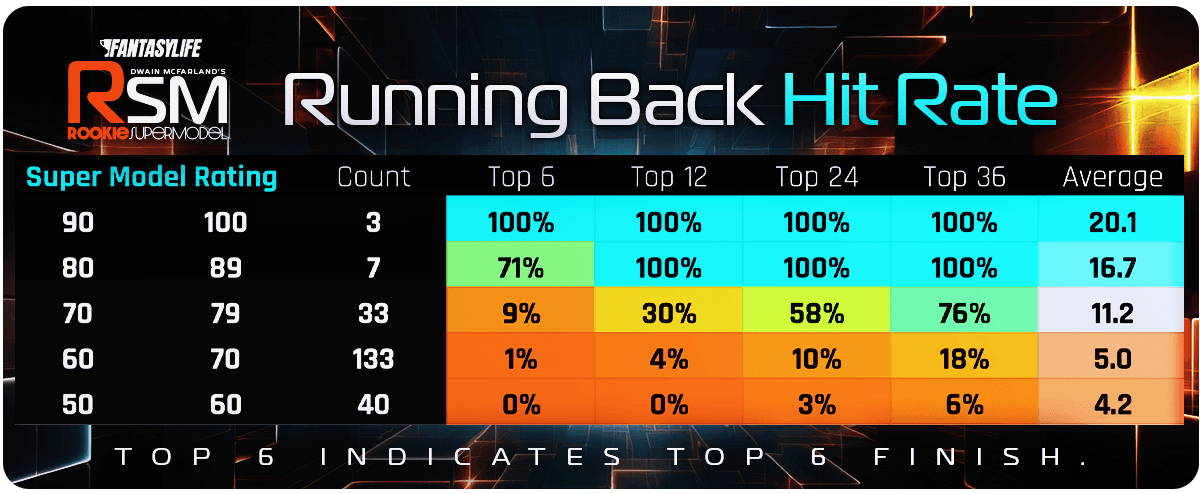
Below is a quick review of how prospects fared over their first three seasons based on their Super Model rating. For example, 100% of the three running backs rated between 90 and 100 notched a top-six fantasy finish within their first three years, while 9% of the 32 backs between 70 and 79 accomplished that same feat.
Running Back Hit Rates
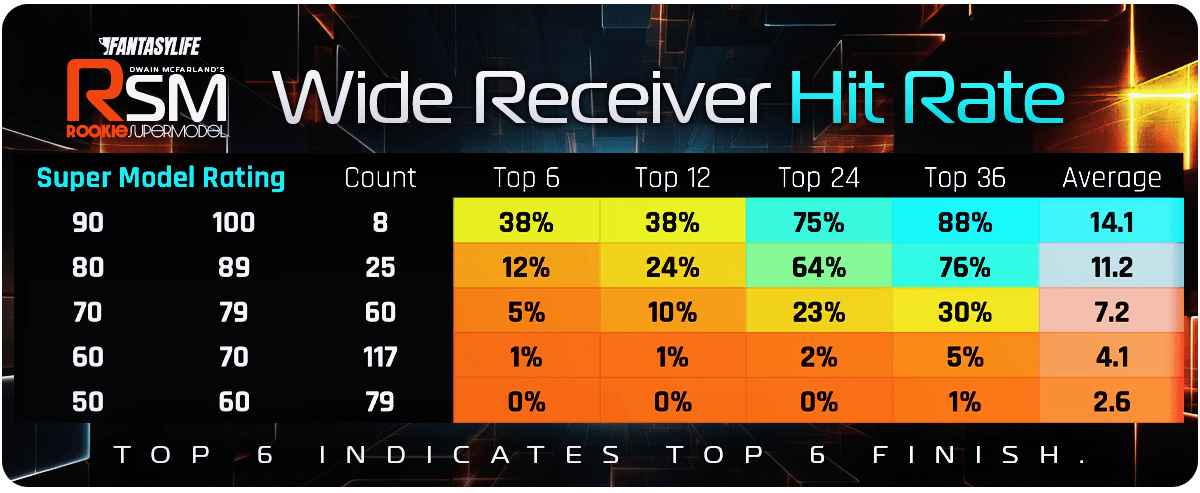
Wide Receiver Hit Rates
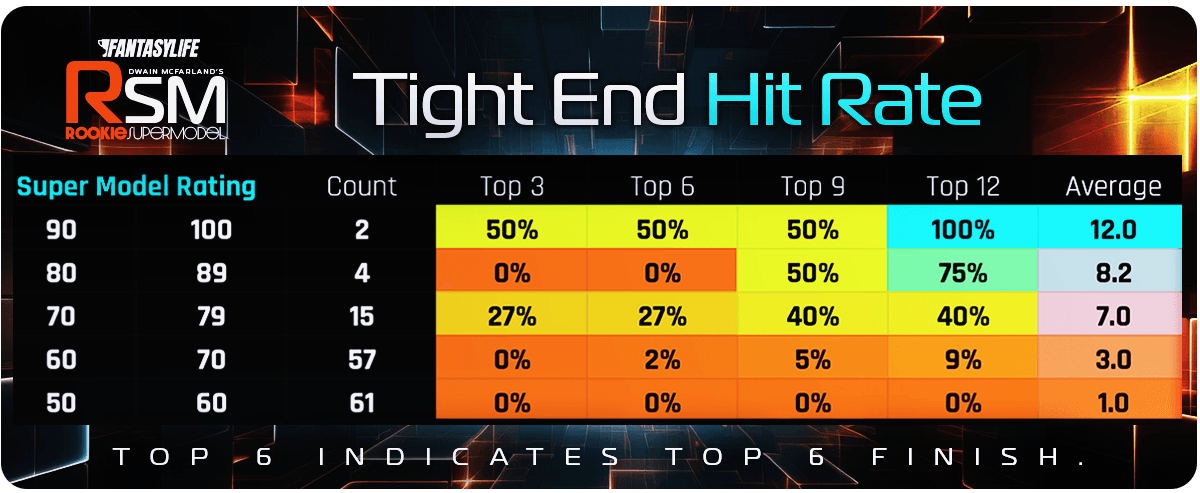
Tight End Hit Rates
Read on for more details about how the Rookie Super Model performed, including side-by-side analysis versus NFL Draft pick.
How are the inputs for the Rookie Super Model selected?
Over the last five years, I have studied and modeled hundreds of variables and developed two primary criteria for selecting inputs:
- Correlation to fantasy points per game over a prospect's first three NFL seasons
- Inputs should be complementary, most notably with NFL Draft Capital
The goal is to have complementary inputs that help provide us with a well-rounded profile that adds value beyond the NFL Draft. There isn't a Rookie Super Model for quarterbacks because I haven't found anything in the data that adds value beyond the draft.
Now is a great time to clarify that I am not a mathematician. Yes, I have a background in data and analytics from my time in the healthcare industry, but I didn't study these topics in university. I simply love data, understanding how things work and football.
OK, back to the point I was about to make before my disclaimer.
The truth is that most variables aren't strong enough, or they overlap too much with an existing input to make it into the model. Even once you cultivate a list of strong inputs, it is hard to accurately predict which college athletes will be the best NFL players.
Football is a sport with countless dependencies played by notoriously unpredictable creatures known as human beings. You can see how this activity can become challenging when you add in plain old variance.
But that makes it interesting and fuels me to test new ideas every offseason, and we made new strides with the model in 2026!
What are the inputs for the Rookie Super Model?
Each prospect's grade is based on the following categories:
- Draft Capital Value
- Production
- Film
- Athleticism
Before we dive into the categories, now is a good time to discuss the importance of data normalization in the model.
Data Normalization
An essential aspect of the Rookie Super Model is data normalization. Age and class, strength of schedule, teammate competition, quarterback quality and team style are all taken into account to level the playing field.
Playing wide receiver on a run-heavy team against SEC competition with a bad QB is not the same as the MAC in a pass-heavy offense, and the model knows that.
Strength of schedule is based on strength of schedule (SOS) from Sports Reference, and the model accounts for each school the prospect attended.
Program quality is part of the normalization process for teammate competition. Of course, program quality also carries a signal for future performance because many of the nation's best teams get there on the back of great recruiting classes (i.e., pedigree). Programs that build great teams know a thing or two about these players!
ESPN's College Football Power Index is used to assess program quality. The model accounts for each school a prospect attended, given the proliferation of transfers.
 Nerd Note: The Rookie Super Model places each model component on a scale of 0-100 rather than using thresholds or cutoffs. There are some data points, like weight, where the model deducts from a player's rating, but it does so on a gradual scale.
Draft Capital Value
NFL Draft Capital is the No. 1 factor in the Rookie Super Model. The reasons for this are two-fold:
- Teams are better at this than most fans think.
- Front offices and coaches are vested in the success of high picks because it reflects on the staff's performance.
Do you want the big project you're part of at work to be a hit? Of course, and you will do everything within your power to help it succeed because that is good for you and your team!
Historically, the golden standard for draft capital in the fantasy community has been draft pick, but the value of a draft pick isn't linear. The fall-off from pick 1 to pick 15 is much larger than from pick 100 to pick 115.
As a result, the model uses Chase Stuart's Draft Value Chart, an improved version of what many know as the Jimmy Johnson trade chart. This adjustment accounts for the larger drop-off in the first round and a flatter drop-off around the end of the second round.
Below are the differences in correlation to fantasy points per game over the first three NFL seasons for draft pick vs. draft capital:
- RB: 0.57 vs. 0.69
- WR: 0.59 vs. 0.66
- TE: 0.62 vs. 0.71
Data from the NFL Mock Draft Database is used before the draft, referred to as projected draft capital.
Production
Each position uses two complementary production components, adjusted for age, strength of schedule, teammate competition and quarterback play. Alignment (inside versus wide) and average target depth (aDOT) are slight adjustment factors for wide receivers and tight ends.
Running Back Production
- Adjusted Yards Per Team Attempt (YPTA): Combines rushing and receiving yards, but receiving yards count twice as much. The per-attempt component allows us to normalize yardage based on the team's play count. A prospect averaging 75 yards per game in a low-volume offense might be better than another averaging 100 yards in a high-volume situation. The model mostly uses career data, but a small percentage is given to a player's best season. Correlation to future production: 0.42.
- Best Receiving Yards Per Team Pass Attempt (RYPTPA): While we are already boosting receiving prowess with YPTA, passing-game viability is one of the more overlooked components of a back's profile when comparing NFL Draft Capital to collegiate production. Given PPR and half-PPR scoring formats, it can also unlock the recipe for fantasy goodness at the NFL level. For this data point, a player's best season is the primary component with a small weight to their career. Correlation to future production: 0.38.
Nerd Note: One of our goals with a model is to identify things that might make a player valuable in fantasy football that differ from NFL Draft pick. Running back receiving ability is a great example. Most fantasy leagues reward 0.5 or 1.0 points per reception. Underneath receptions are not highly valuable to an NFL team. However, they matter in fantasy. That doesn't mean the NFL doesn't value good receiving backs. They do. In fact, they typically prioritize the right ones—the players who can demand targets beyond the line of scrimmage like Christian McCaffrey.
Wide Receiver Production
- Adjusted Career Receiving Yards Per Team Pass Attempt (RYPTPA): This is a weighted version of RYPTPA, with the most significant component being age/class-adjusted. Receivers who performed well in RYPTPA earlier in their careers enjoyed much stronger hit rates early in their NFL careers. In fact, receivers who didn't perform well until Year 4 and Year 5 correlated negatively with NFL success. The model assigns heavier weights to the first three years. Correlation to future production: 0.46.
Nerd Note: Younger players aren't preferred just because they can have longer careers. The data shows that the best players typically succeed sooner in their collegiate careers and enter the NFL sooner. There are certainly exceptions to the rule, such as players who lost one of their first three collegiate seasons to injury.
- Career Targeted QB Rating: This data point tells us the passer rating when a WR is targeted. There is some inherent overlap with RYPTPA because both use yards. However, RYPTPA tells us how a player performed in the context of their team, while targeted QB rating tells us how well a WR performed when targeted. That critical distinction allows the two data points to work well together. Targeted QB ratings have helped the model boost players like Terry McLaurin, George Pickens, Nico Collins and Ladd McConkey, who didn't have a great adjusted RYPTPA. Correlation to future production: 0.40.
Tight End Production
- Adjusted Career Receiving Yards Per Team Pass Attempt: This is handled similarly to receivers, but the age/class-adjusted weights differ slightly. While WRs don't get much credit for their fourth season, TEs can still impact their score with a strong senior season (Year 4). Playing a fifth year is much more common for TEs, but the correlation to future production is negative. Correlation to future production: 0.58.
- Career Targeted QB Rating: See wide receivers above. Correlation to future production: 0.32.
Film
NFL.com Prospect Grades
While I love to watch and chart prospects as much as anyone, it isn't my area of expertise. I also don't have a time-tested grading system I can backtest for predictive performance. Fortunately for us, Lance Zierlein posts his grades ahead of the draft every season on NFL.com, and we have data back to 2014.
Correlation to future production:
- RB: 0.59
- WR: 0.56
- TE: 0.58
Those are powerful numbers relative to other inputs. It is worth noting that film grades have the strongest correlation to draft capital. There could be several reasons for this, but here are a couple:
- Plugged-in draft analysts are in contact with teams and sometimes know how players are valued, which can impact the grading process. When I contacted Zierlein, he said this is especially true for anything he can't see on tape.
- The NFL draft process is still primarily a film-driven evaluation, and Zierlein shared that he has been trained by a few different NFL people.
While I am categorizing this bucket as film, it is also important to note that the grades are a combination of film, projecting ceiling and floor traits.
"Much of it is knowing what you're looking at on film, but part of it is understanding when you're watching a player who is going to potentially be better than what he shows on film. Those are projection grades."
Lance Zierlein
I have a pre-draft capital model used for reference, in which the film receives a significant weight. However, because it overlaps with draft capital, the film rating gets less weight in the Rookie Super Model. However, Zierlein's film grades still provide additive value when paired only with draft capital.
Pro Football Focus (PFF)
For the running back position, a career composite grade is formed from a prospect's PFF Run Grade and Receiving Grade. If you wonder how PFF Grades work, I recommend reading Steve Palazzolo's breakdown. But below are two excerpts for you TLDR folks:
"Credit is given for each move the running back makes to add value to the play, whether forcing a missed tackle, using speed to gain the edge, or creating yards through contact."
"Our goal is to isolate the running back's contribution to that production, and the runners with the highest grades are those who produce above expectation and outside what the run blocking scheme allows."
Steve Palazzolo
PFF Grades account for context we otherwise can't capture at such a massive scale. Because of this, it isn't surprising that the grades correlate more strongly to future production than individual statistics, such as missed tackles forced and yards after contact. Plus, it allows us to present that information concisely in a single data point. Correlation to future running back production: 0.42
Note: We are calculating career grades based on season grades weighted by rushing attempts and passing targets.
Athleticism
I tested all NFL Combine and pro day data, including RAS (relative athletic scores) for all positions. While some athletic tests have signal, they aren't strong enough to make it into the model. However, for the running back and tight end positions, Speed Score proved to be additive to draft capital.
Correlation to future production:
- RB: 0.23
- TE: 0.46
Nerd Note: Athleticism receives the smallest weight in the Rookie Super Model because NFL teams largely account for it with draft capital.
How has the Rookie Super Model performed?
Much of the advanced collegiate data that fuels the model wasn't available before the 2018 class (PFF began charting college teams in 2014, and we need a player's entire career). So, our sample size remains limited, but the results are promising.
Below is how the model has fared when evaluating the first three years of a player's career based on the following criteria:
- Minimum two eligible seasons
- Average fantasy points per game
- Point-per-reception scoring (PPR)
Running Back:
- NFL Draft Pick: 0.57
- NFL Draft Capital: 0.69
- Rookie Super Model without Draft Capital: 0.69
- Rookie Super Model with Draft Capital: 0.73
Wide Receiver:
- NFL Draft Pick: 0.59
- NFL Draft Capital: 0.66
- Rookie Super Model without Draft Capital: 0.64
- Rookie Super Model with Draft Capital: 0.68
Tight End:
- NFL Draft Pick: 0.62
- NFL Draft Capital: 0.71
- Rookie Super Model without Draft Capital: 0.70
- Rookie Super Model with Draft Capital: 0.76
The Rookie Super Model has moved well beyond the historical gold standard in fantasy football: NFL Draft Pick. That was the No. 1 goal for the model.
Without including draft data, the model is performing on par with NFL draft capital. That is pretty freaking cool, y'all! Additionally, when combining the model with draft capital, we get a bump for each position, with the largest deltas at TE and RB.

Join Our Newsletter
Trusted by 400,000+ fantasy football players. Get access to Fantasy Life's free award winning newsletter and tools, all in one step.
By registering or logging in, you agree to our Terms of Use and Privacy Policy.